

RFI Levels The indicator shows all the correct initial impulse levels/zones for buying and selling. When these levels/zones are activated, where the search for entry points begins, the levels change color and are filled with certain shades. Additionally, arrows appear for a more intuitive understanding of the situation. The algorithm is designed for intraday trading both with and against the trend.
Attention !!! Before publishing, we check everything and publish only those indicators that work on our accounts !!! At least at the time of this article’s publication.Also, please note that the name of the indicatorhas been changed, you can find the original name of the adviser in our telegram channel https://t.me/FX_VIP/2246
| Developer price | |
| Terminal | MT4 |
| Currency pair | ANY |
| Timeframe | ANY |
| Recommended brokers | NPBFX, IC Markets, ALPARI |
| For advisor recommended to use VPS 24/5 | Zomro (most affordable Windows server only $ 2.75 per month) |
The professional indicator-free strategy TPSPROSYSTEM is based on three repeating patterns of price behavior, of which the two main ones appear daily. Price movement in the market is subject to the laws of supply and demand. The more funds buyers have, the more they buy assets from sellers, and the price rises, one by one eating up sell orders. Gradually, the main volume flows to sellers, and after a certain point a reverse cycle (bearish) begins. Having learned to accurately determine the moment of the beginning and end of the entry into the market of large players who shape the market movement, we can enter the market together with them, thereby increasing the likelihood of successful transactions.
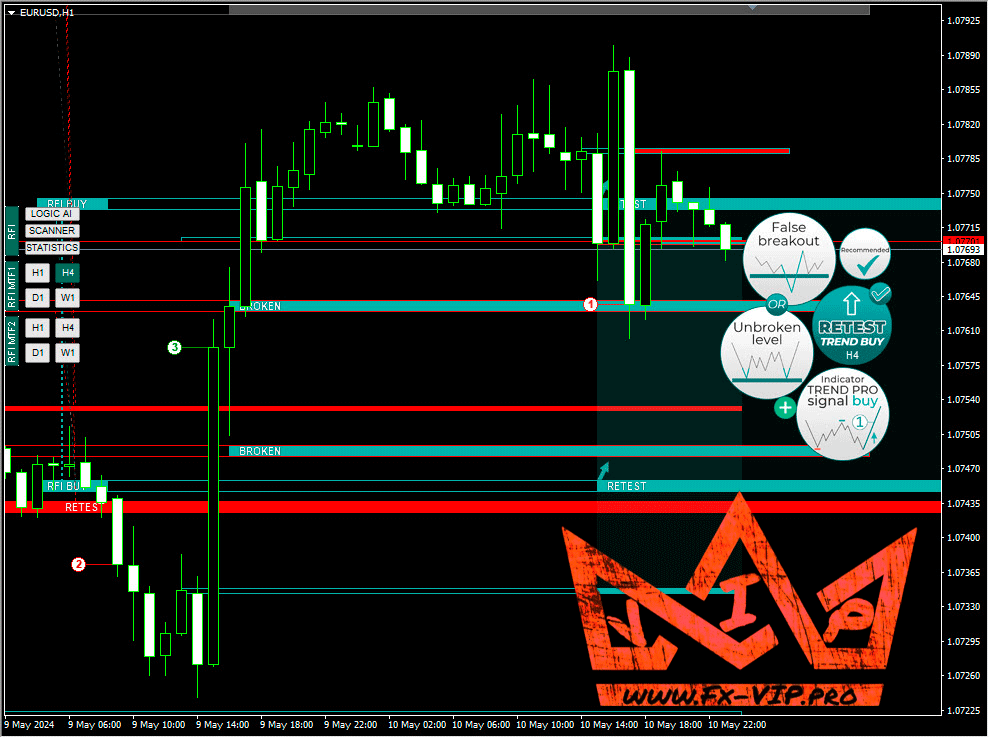
Trading pattern – (RETEST / BROKEN / MIRRORED) – this is the moment when large players made a bet in one of the directions (buy or sell) in a certain narrow range. Once the pattern is formed, the probability of price movement in a specific direction becomes very high.
First Impulse Levels (RFI) are the maximum volume levels/areas that turn the market around, so they play a critical role in future trading decisions. The logic behind the movement of any chart is that the price moves from the first impulse level (RFI) to the first impulse level (RFI) of the past trend. The first impulse level (RFI) is the most powerful level during a trend reversal, which forms a reversal zone. You should look for entry points only after one of the patterns appears on the levels (RETEST / BROKEN / MIRRORED).
With this indicator, you will be able to:
- Determine entry points into the market along the trend and against it with a probability of more than 90%.
- Accurately determine targets (exit points) on any timeframe.
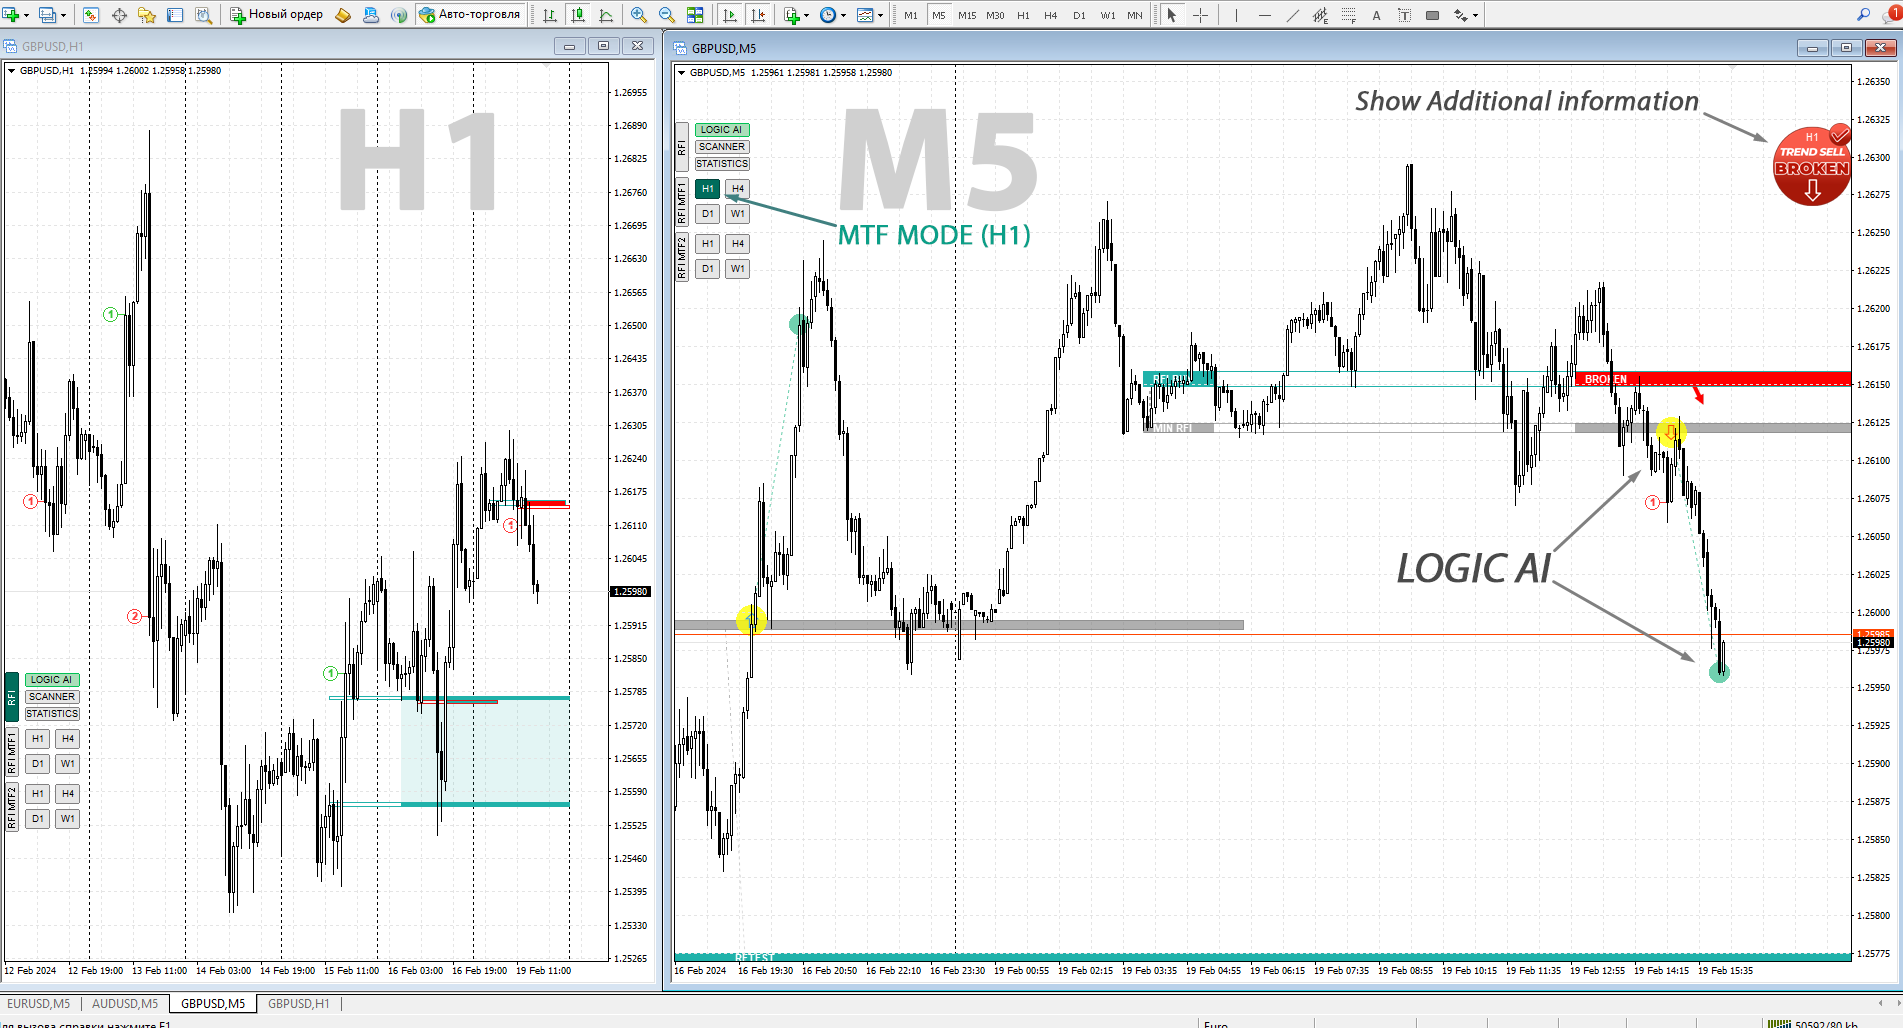
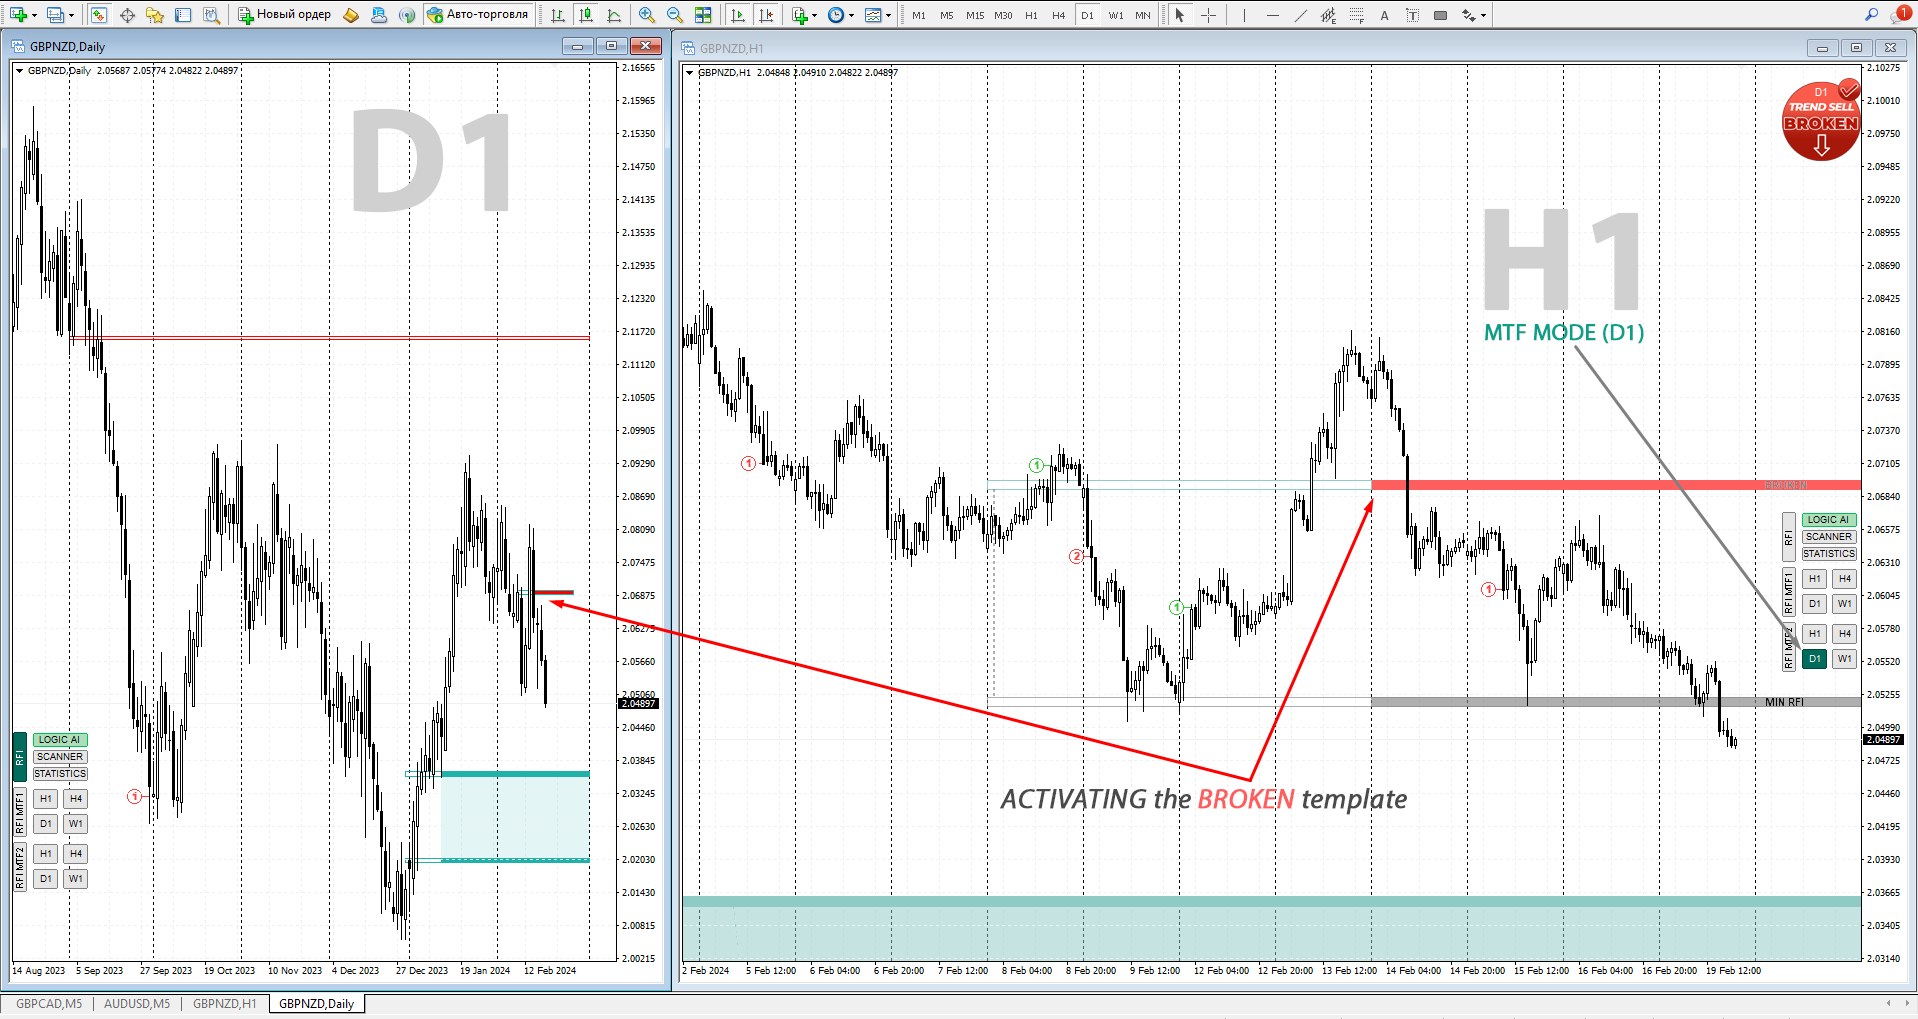
- Activate levels (RFI) from a higher timeframe – MTF mode.
- Just three templates to establish priority for trading.
So, let’s begin. We’ll take the first impulse level RFI that formed after the downward trend reversal (sell-off). We have the beginning of the level, which we refer to as the ‘shoulder,’ and its completion of formation, which we call the ‘RFI completion.
You should already know that RFI, or its zone if it’s broad, represents an area where, for instance taking RFI in a sell scenario, it’s where sellers won, overpowering most buyers, and where the highest number of transactions occurred (peaking). In other words, the maximum volume of transactions took place, leading to the market moving downward. A small clarification: at the moment of forming the RFI reversal zone, we cannot accurately know where it will end. Even with significant trading experience, we can only make assumptions.
Newly formed RFI levels (without templates)
On MTF1 and MTF2, only newly formed RFIs are displayed as grey levels and can be used solely for transactional purposes. WE NEVER TRADE at the exact moment of reversal (formation of RFI), except for ‘MIRRORED,’ which is extremely rare. They are activated by pressing the vertical button – RFI MTF1/RFI MTF2.


We begin to search for trading ideas only at the initial touches – reactions to RFI, after the RFI level/zone has formed. We only know one thing, who dominates the market!
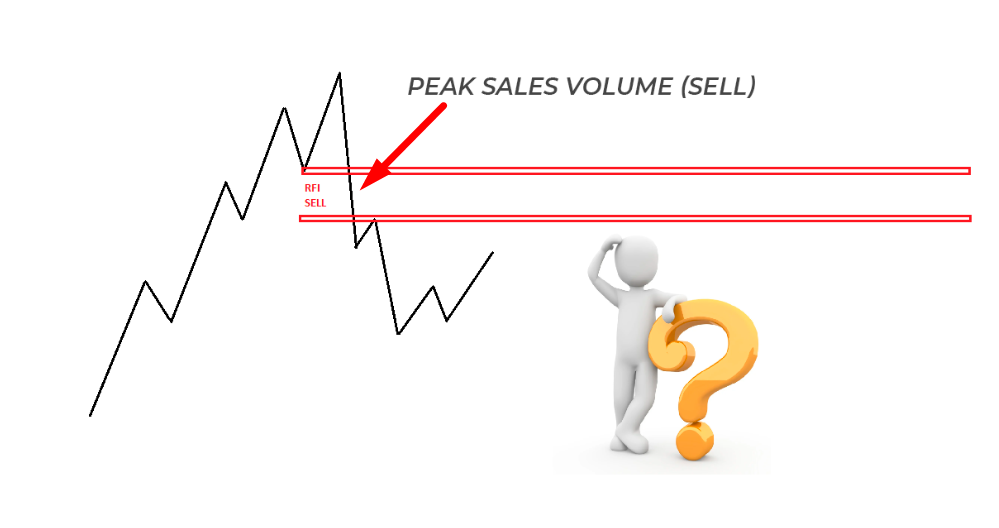
In this RFI SELL, we only know that there is a peak volume that has reversed the market. But we are not taking any action for now. We are waiting for the price to touch this zone/level. And now, what trading ideas can we consider?
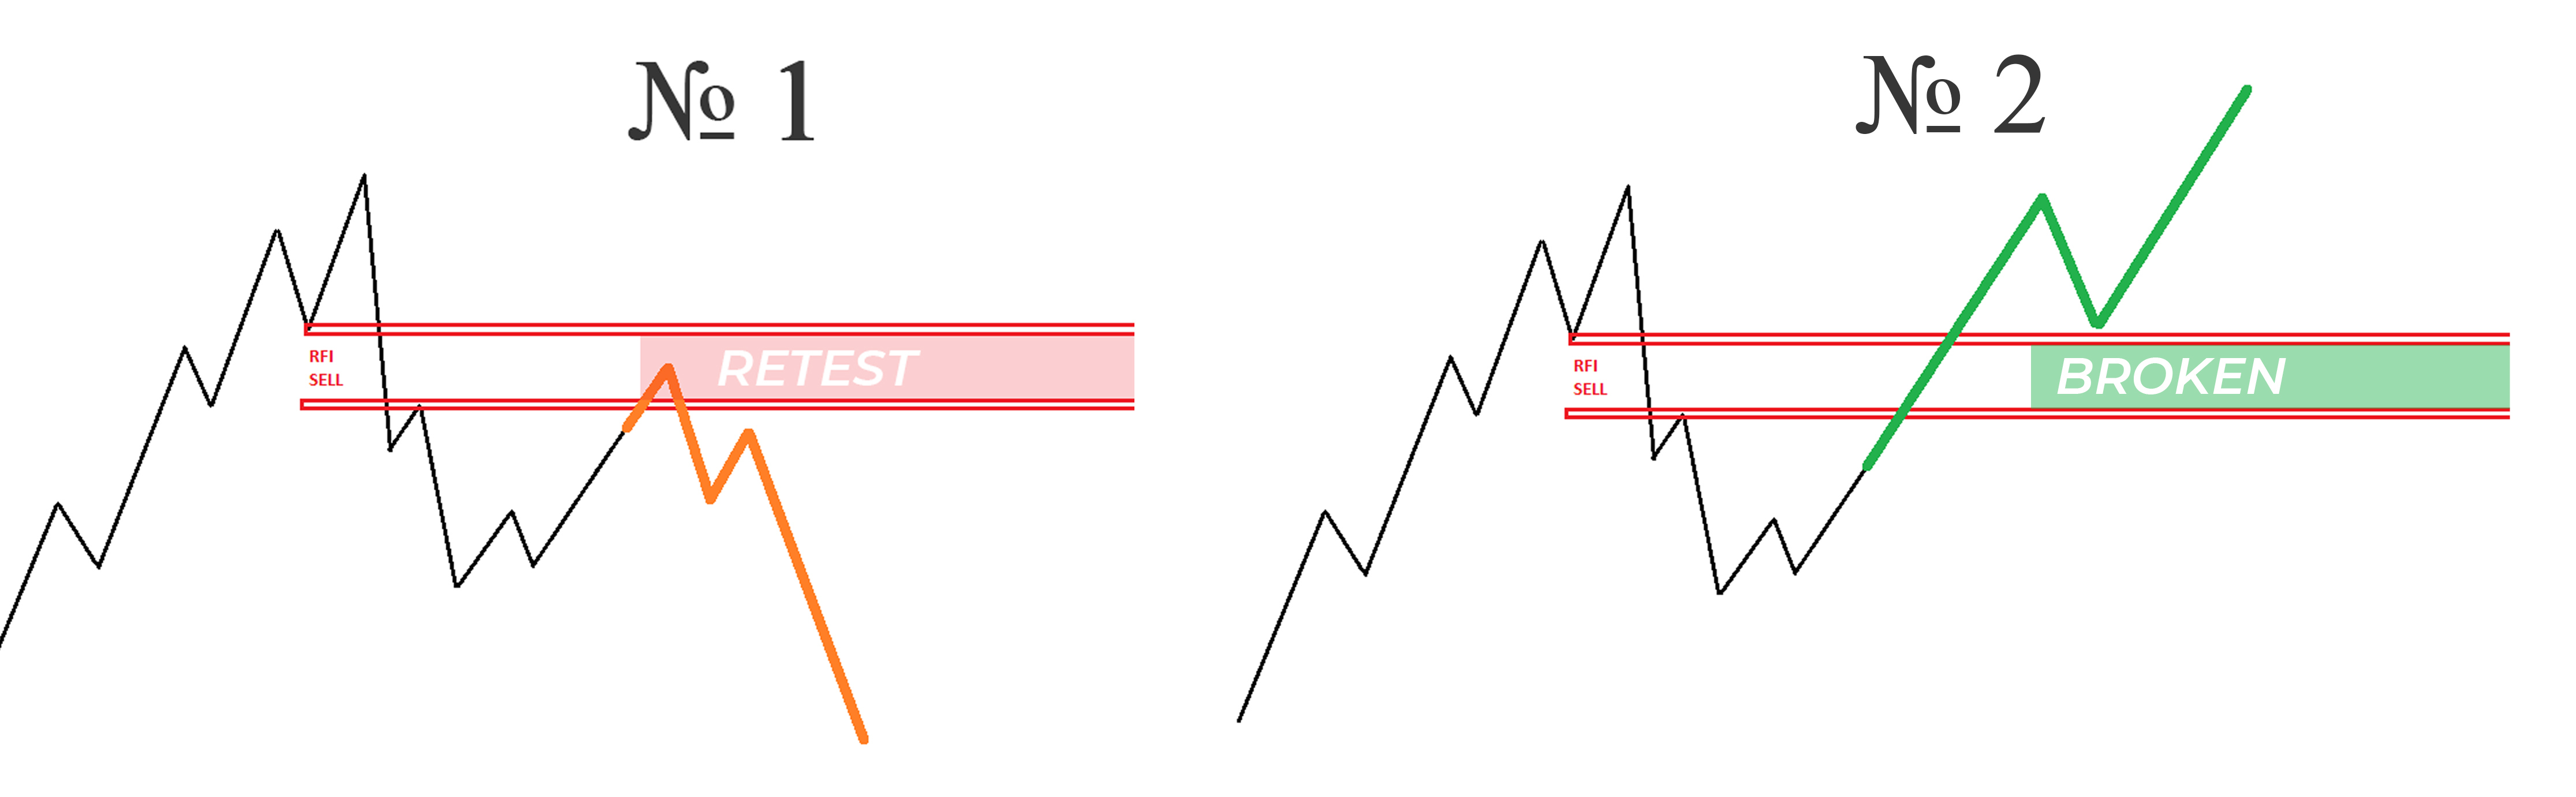
We always have two main options for how events may unfold.
At each stage, I will insist on using the RETEST or BROKEN template in the direction of the trend.
Retest
Retest of the first impulse level (RETEST RFI)
Return of price to the point where peak volume was recorded, which reversed the market. When the RETEST template is activated, it triggers a warning alert and sends a notification to the phone.
Levels RFI with a timeframe of H1 are used for trading. Additional conditions are checked on the M5 timeframe
The activation of the template/retest is determined automatically by the indicator!
After activating the RETEST template, we require the following conditions on TIMEFRAME M5:
1. False Breakout or Non-Breakout of the RFI level
2. Trend change on the current timeframe

We recommend looking for retests and trading with the trend!

BROKEN
The failure of the first impulse level (BROKEN RFI).
False reversal cancellation and continuation of movement with the current trend. Additionally, a yellow circle appears at the level touch or him MAX/MIN – this is the point from which we seek additional conditions for the entry point.
Levels RFI with a timeframe of H1 are used for trading. Additional conditions are checked on the M5 timeframe
The activation of the template/broken is determined automatically by the indicator!
After activating the BROKEN template, we require the following conditions:
1. Touches of RFI level or MAX RFI level (yellow circle).
2. On the M5 timeframe, the trend should align with the direction of the template. If not, it’s advisable to wait for a new trend change.
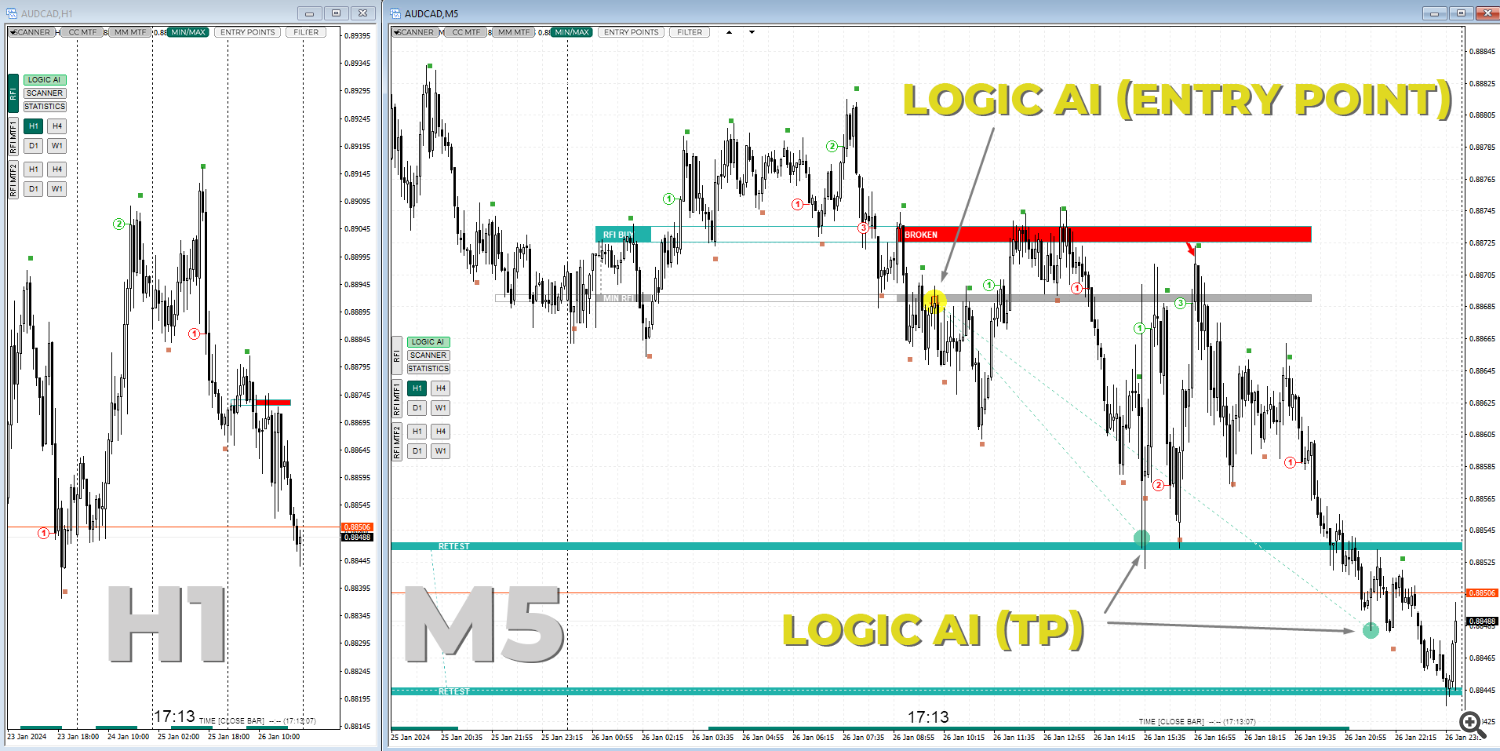
LOGIC AI
LOGIC AI For the BROKEN template, a separate logic has been added. After activation, it displays entry point search areas, minimum levels for TP1/TP2, and determines the template cancellation point, after which it cannot be used for trading. (There is a separate LOGIC AI button on the panel to activate this logic).
- Yellow circle – A place to search for an entry point (touching the level of ±20 pips).
- Green circle №1 – The first minimum take profit ≈ 150 pips.
- Green circle №2 – The second take profit (2 logics).
- Red circle – Worked out pattern (situation) in the negative.
- Gray circle – Pattern annulment.
IMPORTANT!! With an active BROKEN template, we should not have a false breakout at the MIN/MAX RFI level!!! If you already have a trade open, it’s necessary to minimize risks. It’s recommended to use the ‘BROKEN template’ for trading only in the direction of the trend! We recommend trading the BROKEN template only up to two corrections of the higher trend.

Settings
RFI Current Timeframe / Hot button (R) / Displaying RFI levels for the current timeframe.
- RFI Sell – Color of RFI SELL levels (sell levels/zones)
- RFI BUY – Color of RFI BUY levels (buy levels/zones)
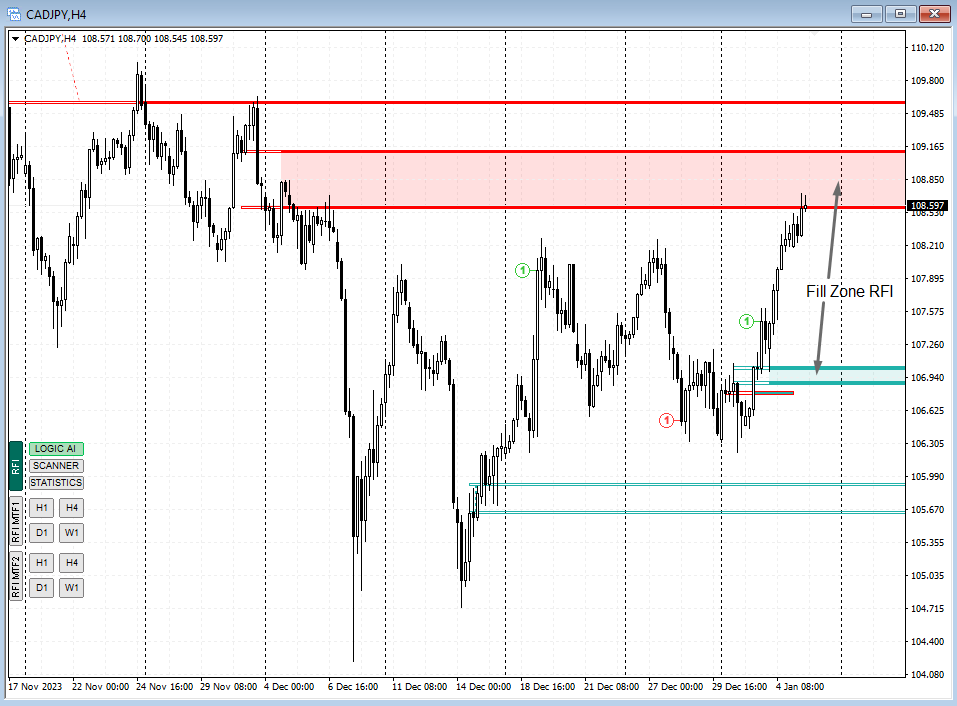
- Fill Zone RFI – Inner fill for two-level RFI
- RFI UP DOWN – Number of displayed levels up/down
- Show Additional information (circle) – Displaying information about the current template.
- Max Indicator Bars – Number of bars for analysis
Multitimeframe (MTF 1) Hot button / Displaying levels from a higher timeframe
- RFI1 timeframes – Select timeframes for display on the panel.
- RFI SELL – Color of RFI SELL levels (sell levels/zones)
- RFI BUY – Color of RFI BUY levels (buy levels/zones)
- ATR (height of levels) – Level height parameter (Value 1: Automatic adjustment based on ATR)
- Active Templates & RFI UP DOWN – Number of displayed levels up/down
- AUTO-Reminder – Automatic expansion of additional information for the current template within 5 minutes.
- Show Additional information (circle) -Displaying information for the template.
- Show Alert to active template + Notification – Displaying alerts and push notifications on the phone upon template activation.
- Enable animation (GIF) – Enable animation for the information circle (in case of trend direction and pattern alignment). (Recommended for trading )
- Name Sound – Sound name for Alert
- Max Indicator Bars – Number of bars for analysis

2 Multitimeframe (MTF 2) Hot button / Displaying levels from a higher timeframe
- RFI2 timeframes – Select timeframes for display on the panel.
- RFI SELL – Color of RFI SELL levels (sell levels/zones)
- RFI BUY – Color of RFI BUY levels (buy levels/zones)
- ATR (height of levels) – Level Height Parameter (Value 1: Automatic adjustment based on ATR)
- Active Templates & RFI UP DOWN – Number of displayed levels up/down
- Show Additional information (circle) – Display information for a template.
- Show Alert to active template + Notification – Display Alert and push notifications on the phone when the template is activated.
- Name Sound – Sound name for Alert
- Max Indicator Bars – Number of bars for analysis
IT IS IMPORTANT!!! THIS WORKS AND HAS BEEN TESTED WITH BUILDING 1415
Reminder: As with every trading system, always remember that forex trading can be risky. Don’t trade with money that you can not afford to lose. It is always best to test EA’s or indicators first on demo accounts, or live accounts running low lotsize. You can always increase risk later!
Recommend, in order not to miss important news and updates on the site, subscribe to our telegram channel https://t.me/Fx_VIP
DOWNLOAD TPS TREND Pro MT4 v6.3


DOWNLOAD RFI Levels v5.4 MT4
Sunray
23/06/24
Говорят то что работало ранее- вМТ4 v. 1420 уже не работает.