

We haven’t published tools and strategies for manual trading for a long time, today we will fix this and introduce you to a tool that shows the strength of currencies and is ideal for determining trends and accurate entries. We will also tell you how to use it and about a trading system called Double-GAP based on this indicator. The indicator for unlimited use can be downloaded free from the links at the end of the post!
Attention!!! Please read carefully the rules for installing the Indicator, and install it correctly. Before publishing, we check everything and publish only those Indicators that work on our accounts !!! At least at the time of this article’s publication. Also, please note that the name of the Indicator has been changed, you can find the original name of the Indicator in our telegram channel https://t.me/FX_VIP/2493
| Developer price | |
| Terminal | MT4 |
| Currency pair | Any |
| Timeframe | Any |
| Money management | At least 100 currency units |
| Recommended brokers | IC Markets |
| For advisor recommended to use VPS 24/5 | vps24hour – Excellent inexpensive VPS for $3 per month you can use up to 3 terminals!!! |
Forex28 Navigator uniquely designed to assess and display both currency strength and momentum using an innovative formula and a set of cutting-edge features. This tool is integral to Double-GAP Strategy — a primary trading methodology that capitalizes on the dynamic interplay of currency strength and weakness.
Double-GAP Strategy
The principle idea is buying strength and selling weakness. This is a fundamental strategy for investors in all marketplaces. Most amateur retail traders in Forex either ignore this winning strategy or are unaware of it.
With this strategy, we look at individual currencies rather than currency pairs and then buy the strong currency and sell it against the weak currency. This will give your trading a real edge.
When we refer to the Market we mean THE 8 main currencies and the 28 FX pairs that are derived from those 8 currencies.
The market has to be seen always in equilibrium. If one currency is bought some other(s) must be sold. This we could call her money flow. (We may use terms in a different way as they are used usually on this site).
When we analyze the market we look at the whole market which to us is 8 currencies and 28 pairs. (Exotic pairs are not included for now.)
When most traders look at a chart to find a trade setup they would need to check 28 charts to understand what the Forex market is doing. When you use the Currency-Strength28 strategy you only look at currencies, not pairs, and for that, we need to check only ONE CHART! Do you understand now the edge?
So lets first have a look at the 8 main currencies which are:
US Dollar, Euro, Yen and Pound, these are the most important because they have the largest trading volume, then there are Swiss Franc, Australian, Canadian and New Zealand Dollars.

Each single currency belongs to a single economy. Some currencies are trending up some currencies are trending down, this information you can not see from a single pairs chart. For example: if the EURUSD pair is trending up you do not know why from looking at a single chart. Maybe the Euro is strong and the USD is flat or the Euro is flat and the USD is weak or even both are strong and the Euro is just stronger. Remember in any chart there are two currencies they are called the BASE and the QUOTE currency.
To maximize your wins and minimize your losses you need to know what an individual currency is doing in the context of the whole market. Staying with our EURUSD example: an EURUSD chart will show you only 1/28th of the market so you only have a small amount of information to base your trading decision on. Given that each currency can be paired with 7 other currencies you should be basing your trade decision on the information that all 14 pairs give you. By using the CStrength28 indicator you can get all that information from just the one chart.
Now you may know all of that already but stay put we will add new kind of technical analyses!
The goal of the strategy is to find out the sentiment of the market and which pair is good to trade and which pair is not. As a trader, you should know if a currency is trending, consolidating or reversing as this will give you information on how to trade. Do we look for continuation or do we look for pullback/reversal? This is THE most important information you need to trade and this strategy will give you the answer!
1112 pips winner!
With 1 lot trade size, it will pay about $10 per pip depends slightly on the pair.

The CURRENCY GAP
Terms I will be using in this blog may be different from usual.
CS=Currency Strength Line, GAP=(currency up or down), sGAP=single GAP, dGAP=double GAP, iGAP=inside GAP, oGAP=outside GAP, iDir=inside Direction, oDir=outside Direction, MaMom=Market Momentum, MFib=Market Fibonacci level.
Now we will go to some examples for illustration. I prefer a graphical demonstration.
The Currency GAP is used for a move of single Currency (up or down after candle close for the last 2 or 3 bars in a defined angle)

sGAP or single GAP (CS weak against weaker)

dGAP or double GAP (2x GAP in opposite direction)

Definition of double-GAP how it is used here:
We need 2 separated Currency GAP’s to get one double GAP:
Example EURNZD:
We check after a candle closed:
Take the currency strength of EURO and compare it 2 candles back to get the EUR GAP
Take the currency strength of NZD and compare it 2 candles back to get the NZD GAP
IF EUR GAP is down and NZD GAP is up = sell EURNZD

This is a double GAP!
The double-GAP (dGAP) is always a currency move in the opposite direction. It is the separated currency strength change of the base and the quote currency.
The single GAP:
After we have seen the double GAP (dGAP) we need also understand the simple GAP (sGAP) which is often used. It is the currency strength change between the base and the quote currency. A double GAP is always a simple GAP too but a simple GAP is not always a double GAP.
A simple GAP can be:
Currency A is weak and currency B is WEAKER
Or currency A is flat and currency B is stronger
Or currency A is little weak and B is stronger
And those are weak trades and vulnerable to pullbacks.
A double GAP means 2 separated triggers so we look at quote and base currency separated:
Currency A is weak and currency B is strong
Or currency A is strong and currency B is weak
This applies to every time frame (analyses in multi-timeframe we will see later!).
Again back to the GAP.
To define a currency (CS) is weak or strong I look at the slope (angle) of at least the last 2 bars or periods (because the currency line is not a candle should be called over 2 periods).
Those GAPs are to flat:

Those are nice CS angles:

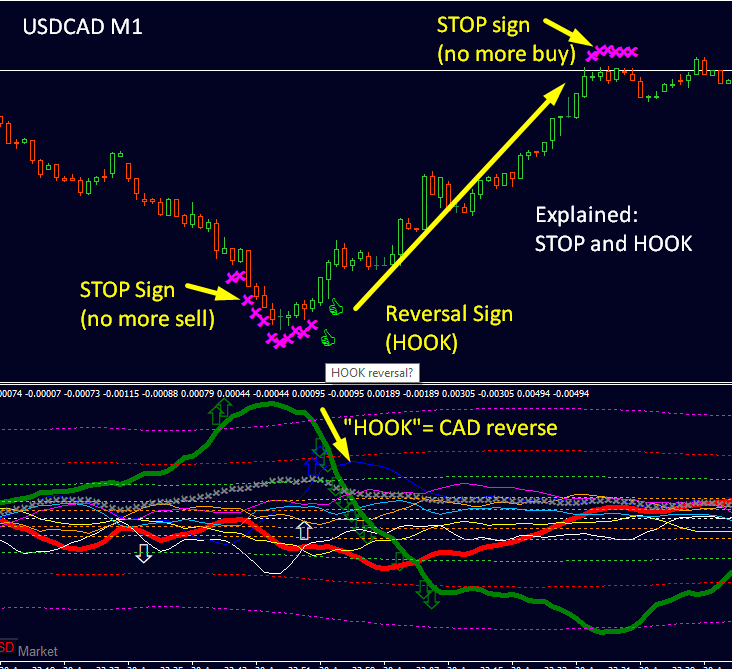
I also differentiate between outside and inside GAP (oGAP, iGAP). As borderline we use the zero-line.
oGAPs (outside GAPs)
You see here strong JPY oGAP up and EUR oGAP down. So EURJPY was in a nice down move.

iGAPs (inside GAPs)
Here are inside GAPs. For iGAPs I like see the angle stronger and coming from extreme outer zones.

To be strong up-slope from negative zones must be steeper than up-slope within positive zones. Because if the currency is still in the negative zone it has still weak sentiment until it crosses the zero market line. To look only at numbers or arrows (like many indicators) give only a small picture or fraction of the information.
Be aware an iGAP is still only a pullback until it crosses the zero line. If you trade iGAPs you must have experience with pullback trading. Easier for beginners are the oGAPs trades.
Scan all 28 Forex pairs with only ONE chart
Some more theory to understand the Forex market of the 8 main currencies, I call it The markets equilibrium:
All 8 currencies are at all times in equilibrium, which means the total volume of selling is always equal to the total volume of buying. We can see this now how the indicator shows. If we compare all positive values against all negative values they are equal. So the conclusion is if one currency is sold strongly there MUST be one or more currencies be bought. No money is lost, make sense?
Our job as a trader is to find out where the currency flow is going. It make no sense to sell a weak currency against another weak currency only because it is a little weaker, we have to find out which currency is strong and trade strong against weak!

In this picture we see the 8 currencies with the 8 colors. :
Positive values A: EUR+CHF+CAD+AUD
Negative values B: GBP+USD+NZD+JPY
A is equal to B just negative.
It does not mean we have always 4 values positive, there can be 3 positive and 5 negative or even 2 to 6, it will be always A=1/B. So what we learn from it as a trader? If one currency is very strong (major news) then there MUST be one or more weak currency, so there we go for a trade!
Trade with the market, don’t go against !!!
This is a perfect setup. Can you SEE?? Do you see the whole market in a blink of an eye?

You see it, right?
If something is strongly bought then there MUST be something else strongly sold. So get the right picture of the market but quick and buy the one going strong up against the one going strong down!
Trade example CADJPY
- First trade was a BUY dGAP oDir, it was closed when CS weakened and got a hook. Then CADJPY reversed as expected. (The first trade could have had an earlier entry but I was not on computer.)
- When it crossed the 0-line I get short so SELL its a dGAP oDir too but with inverted CS-line. Those short was closed as well when CS weakened and got a hook.
- At the end you see again a long this time the BUY is a dGAP with iDir, the angle was steep, I did not wait for cross the 0.
this is m30

Trade example AUDJPY
- First trade was a SELL dGAP oDir, it was closed when JPY weakened and got a hook at 100 MFib.
- Then AUD reversed at MFib 161 with strong slope and JPY as well, it was time of London Open. I entered long it is a dGAP with iDir, the angle was steep both currencies came from higher levels, I did not wait for cross the 0. The BUY was closed when JPY showed flat at MFib 50 and AUD got a hook right before MFib 161.
this is m15

Trade example CADJPY
Both CS have reversed around MFib 100 at time of London Open. Entry was when CS crossed the 0-line and also the MFib 50. Profit was taken at 85 pip. Enough… CS were above MFib 100 and 161 at this time.
This is m30

Trade example USDCAD
Same day as trade above. Counter part here USD. USD not the strongest slope but steady, it was just crossing the MFib 23 to show bearish sentiment, CAD was just at 100 MFib at entry. Profit was taken at 95 pip.
This is m30 too

Why Choose Currency Strength Trading?
Currency strength trading is widely recognized among seasoned traders as one of the most profitable trading strategies. By focusing on currency pairs where one currency is strong and the other is weak, traders can optimize their chances for successful trades. The Forex 28 Navigator is specifically engineered to enhance this approach, providing real-time insights that allow for precise decision-making.
Key Features of Forex 28 Navigator
- Real-Time Currency Strength Analysis: Accurately measures and displays the strength and momentum of each currency across 28 major pairs, allowing traders to identify profitable trading opportunities.
- Momentum Measurement: Uniquely tracks the momentum (old: GAP) at which a currency is gaining or losing strength, giving traders an additional layer of analysis for better timing their trades.
- Innovative Formula: Utilizes a proprietary algorithm to calculate currency strength and momentum, offering a more refined and accurate representation of market conditions compared to traditional indicators.
- Comprehensive Trading Strategy Integration: Designed to be a core component of Double-GAP Strategy , seamlessly integrating into a broader trading strategy that emphasizes exploiting currency strength differentials.

Key Features and Innovations:
- New Formula for Currency Strength Calculation:
- The indicator utilizes a proprietary formula that provides smooth and accurate currency strength lines across all time frames. This allows traders to effectively identify general trends on higher time frames and pinpoint precise entries on shorter time frames.
- The indicator utilizes a proprietary formula that provides smooth and accurate currency strength lines across all time frames. This allows traders to effectively identify general trends on higher time frames and pinpoint precise entries on shorter time frames.
- Dynamic Market Fibonacci Levels:
- Currency Strength28 PRO uniquely applies Dynamic Market Fibonacci Levels to currency strength. These levels adapt both dynamically and historically to current market activity, optimizing each time frame individually for enhanced accuracy and relevance.
- Currency Strength28 PRO uniquely applies Dynamic Market Fibonacci Levels to currency strength. These levels adapt both dynamically and historically to current market activity, optimizing each time frame individually for enhanced accuracy and relevance.
- Market Momentum Line:
- The 9th line represents Market Momentum, which indicates whether the market is active or passive. This feature is crucial for timing trades and understanding the overall market environment.
- The 9th line represents Market Momentum, which indicates whether the market is active or passive. This feature is crucial for timing trades and understanding the overall market environment.
- Arrows for Strong Currency Momentum (“old: GAP”):
- Visual indicators in the sub-window display arrows for strong currency momentum, helping traders quickly identify profitable “GAP” opportunities.
- Visual indicators in the sub-window display arrows for strong currency momentum, helping traders quickly identify profitable “GAP” opportunities.
- Arrows and alert for Base and Quote Currency Momentum (“old: dGAP”):
- In the main window, arrows highlight strong Dual Momentum for both the base and quote currencies, complete with alerts. This feature enhances decision-making by providing real-time momentum insights.
- In the main window, arrows highlight strong Dual Momentum for both the base and quote currencies, complete with alerts. This feature enhances decision-making by providing real-time momentum insights.
- Filter and Alerts for Combined Conditions:
- A specialized filter combines the cross and outer range conditions, triggering a vertical line and an alert when all criteria are met. This feature ensures that traders are notified of the most promising trading setups.
- A specialized filter combines the cross and outer range conditions, triggering a vertical line and an alert when all criteria are met. This feature ensures that traders are notified of the most promising trading setups.
- Signal Information on Main Window Display:
- The main window displays detailed signal information, including the strongest BUY and SELL Momentum, Dual Momentum Pairs, and filter info, as well the Market Conditions. The buttons allows for quick chart access, streamlining the trading process.
- The main window displays detailed signal information, including the strongest BUY and SELL Momentum, Dual Momentum Pairs, and filter info, as well the Market Conditions. The buttons allows for quick chart access, streamlining the trading process.
- Overbought/Oversold Warnings:
- Visual warnings (X-STOP) are displayed when a currency enters an oversold or overbought zone (Outer Range Fibonacci Levels), helping traders avoid potential reversals.
- Visual warnings (X-STOP) are displayed when a currency enters an oversold or overbought zone (Outer Range Fibonacci Levels), helping traders avoid potential reversals.
- Hit and Pullback/Reversal Alerts (HIT & HOOK):
- Alerts are triggered when currency strength drops back from the Outer Range, complete with an arrow indicating the potential for a pullback or reversal. With historical arrows.
- Alerts are triggered when currency strength drops back from the Outer Range, complete with an arrow indicating the potential for a pullback or reversal. With historical arrows.
- Special Cross Pattern Alerts:
- The indicator provides alerts and visual objects in the sub-window to highlight special cross patterns, which can be critical for identifying high-probability trades.
- The indicator provides alerts and visual objects in the sub-window to highlight special cross patterns, which can be critical for identifying high-probability trades.
- Optimized Data Handling:
- The indicator is designed to minimize data calls from external pairs, reducing the load on your trading platform and enhancing performance.
- The indicator is designed to minimize data calls from external pairs, reducing the load on your trading platform and enhancing performance.
- Automated Support Charts:
- Automated charts support faster broker feeds, ensuring that traders have access to real-time data without delays.
- Automated charts support faster broker feeds, ensuring that traders have access to real-time data without delays.
- Quick Chart Switching:
- Buttons are available for rapidly switching between different charts, allowing for efficient analysis across multiple currency pairs.

How It Works:
Once the Forex 28 Navigator indicator is added to a single chart, it provides comprehensive signals for all 28 Forex pairs. The indicator not only offers real-time data on strength and momentum but also draws historical signals on the chart, allowing traders to backtest strategies and review past market behaviors.
Conclusion:
By merging our most advanced indicators into one product and integrating sophisticated features such as Dynamic Market Fibonacci Levels and the proprietary currency strength formula, Forex 28 Navigator stands out as the best currency strength indicator available. Its innovative features and user-friendly design make it an essential tool for any serious Forex trader.

Dynamic Market Fibonacci Levels (MFib) Explained
What Are Dynamic Market Fibonacci Levels?
Dynamic Market Fibonacci Levels (MFib) are a groundbreaking feature of the Advanced Currency Strength 28 indicator, taking traditional Fibonacci levels to a whole new level by applying them to currency strength rather than price charts. This innovative approach provides traders with a more comprehensive view of the market, allowing for better-informed decisions based on broader market activity.
How Do Dynamic Market Fibonacci Levels Work?
Unlike standard Fibonacci levels that are applied to price charts, Dynamic Market Fibonacci Levels are based on the overall market activity across all 28 currency pairs. This unique method helps traders align their trades with market makers’ activity, ensuring they are on the right side of the trade during crucial market movements.
For example, on minute charts, you can observe increasing market activity at the London open and a decline around the London/New York close, giving you clear insights into when to enter or exit trades.
Key MFib Levels and Their Uses:
- MFib 161 and 261 – Market Fibonacci Retracement Zones:
- These levels (MFib 161/-161 and MFib 261/-261) are crucial for identifying potential reversal zones and assessing strength sentiment. When currency strength lines approach these levels, it signals a possible reversal or a significant change in market sentiment.
- These levels (MFib 161/-161 and MFib 261/-261) are crucial for identifying potential reversal zones and assessing strength sentiment. When currency strength lines approach these levels, it signals a possible reversal or a significant change in market sentiment.
- MFib 100 – Entry Timing:
- The MFib 100 level is used to determine whether you are entering a trade early enough. It acts as a checkpoint, helping traders avoid late entries that might miss the optimal profit window.
- The MFib 100 level is used to determine whether you are entering a trade early enough. It acts as a checkpoint, helping traders avoid late entries that might miss the optimal profit window.
- MFib 23 – Sentiment Check:
- Some traders also use the MFib 23 level to gauge market sentiment (MFib 23/-23). This level is optional but can provide additional confirmation that the market is moving in the direction of your trade.
- The MFib 23 value is also utilized to calculate the momentum value, which is used to trigger the momentum arrow, highlighting strong momentum shifts.
Combining MFib Levels for Enhanced Alerts:
When combined, these MFib levels contribute to various advanced functions within the indicator:
- HIT and HOOK Alert:
- This alert is triggered based on the interaction of currency strength lines with key MFib levels, providing timely notifications of potential trade opportunities.
- This alert is triggered based on the interaction of currency strength lines with key MFib levels, providing timely notifications of potential trade opportunities.
- Pink Stopper Sign:
- The pink stopper sign acts as a warning for extreme levels, signaling that the market may be reaching a point of exhaustion or reversal.
Conclusion:
The Dynamic Market Fibonacci Levels in Forex 28 Navigator offer a powerful, unique tool for Forex traders. By applying Fibonacci levels to currency strength across the entire market, traders gain access to insights that are not available with any other currency meter. These levels, when used in conjunction with the indicator’s other features, provide a comprehensive framework for making more precise and informed trading decisions.
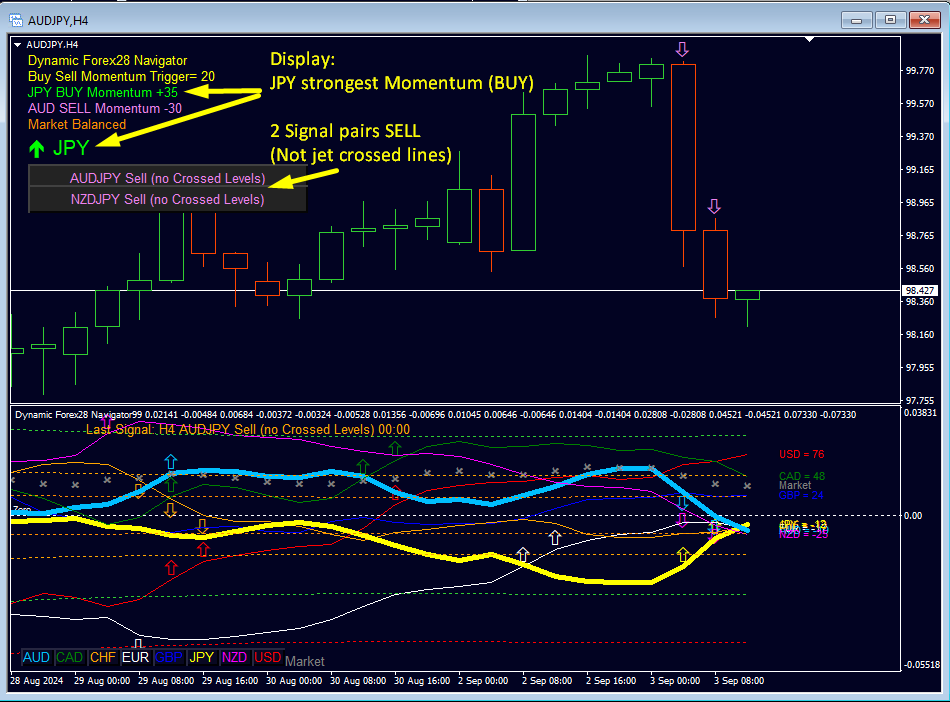
Dynamic Forex28 Navigator Display Overview
- BUY SELL Momentum Trigger
- Description: Indicates the current momentum value set at 20-23, which triggers the momentum arrow when the specified conditions are met.
- Description: Indicates the current momentum value set at 20-23, which triggers the momentum arrow when the specified conditions are met.
- Strongest BUY Momentum
- Description: Displays the currency with the strongest upward momentum (e.g., NZD 27 buy), showing the Momentum value in green.
- Description: Displays the currency with the strongest upward momentum (e.g., NZD 27 buy), showing the Momentum value in green.
- Strongest SELL Momentum
- Description: Displays the currency with the strongest downward momentum (e.g., USD -29 sell), showing the Momentum value in red.
- Description: Displays the currency with the strongest downward momentum (e.g., USD -29 sell), showing the Momentum value in red.
- Market Activity
- Description: Provides real-time market conditions with five possible statuses, including warnings like “Market Volatile!!” for high volatility periods.
- Description: Provides real-time market conditions with five possible statuses, including warnings like “Market Volatile!!” for high volatility periods.
- Leading Currency Momentum
- Description: Highlights the currency with the most extreme momentum, either the strongest or the weakest, giving traders a quick overview of significant market movements.
- Description: Highlights the currency with the most extreme momentum, either the strongest or the weakest, giving traders a quick overview of significant market movements.
- Dual Momentum Signals on Closed Bar BUY/SELL with Alert
- Description: Lists multiple signals that meet the specified conditions, indicating Dual Momentum. Each signal includes the currency pair, action (buy/sell), and confirmation of conditions met (“Crossed Levels” and “Outer Range!”), where currencies have crossed or reached outer ranges. Clicking on a signal opens the corresponding chart.
Key Input Parameters for Dynamic Forex28 Navigator
BUY & SELL Momentum Settings
- BUY SELL Momentum Trigger on Fib slope (18-26)
Sets the BUY & SELL Momentum Market Fibonacci level (23 slope) to indicate momentum. - Draw BUY & SELL Momentum Arrow (sub-window)
Displays arrows in the chart sub-window to indicate strong currency BUY & SELL Momentum.
Dual Momentum Alert Settings
- Draw Arrow for Dual Momentum (main window)
Displays arrows for all detected Dual Momentum signals (Strong momentum for base and quote currencies). - Draw V-Line on Dual Momentum
Draws vertical lines on confirmed Dual Momentum signals with filters. - Alert Dual Momentum
Dual Momentum Filter Settings
- Show Outer Range Info
Displays Outer Range information in the chart for better analysis. - Outer Outer Range Max Level (100-161)
Sets the outer Outer Range max level for oversold/overbought zones. - Show CS Crossed Levels Info
Displays Crossed Levels alongside Outer Range info.
CS Alert Settings
- Alert Outer Range Trigger HIT
Alerts when currency strength reaches the Outer Range Market Fibonacci levels. - Alert Outer Range Trigger HOOK
Sends alerts for pullback/reversal when currency strength drops back from the Outer Range.
Settings Reversal or Exit
- Alert Outer Level HIT
Alert when Outer Range Fib is hit. - Alert Outer Level HOOK (reversal)
Alert reversal HOOK for potential reversals. - HOOK Outer Fib Trigger Level (161-262)
Fib level for above - Hook min Dual Momentum (20-48)
- Draw Reversal HOOK Arrow (Thumb)
- Draw Outer Fib Stop
Indicates outer Market Fibonacci stop levels on the chart. - Outer Fib Stop value (100-261)
Minimum Fib for above.
CS CROSS Alert Settings
- Activate Currency Crossed Levels Functions
Enables currency Crossed Levels signs for key market signals. - Cross Fib Slope (20-46)
Minimum dual momentum. - Alert Currency Crossed Levels
Alerts for currency Crossed Levels events when enabled.
General Alert Settings
- Enable Popup Alerts
Turns on popup alerts for key market events. - Send Email Alerts
Sends email alerts for currency strength signals. - Send Push Notifications
Sends push notifications to your phone for alerts.
Other Settings
- Quick Chart Open in New Window
Allows quick chart switching by clicking on two currency names or the alert buttons, opening the new pair in a separate window.
- Open Support Charts
Opens support charts to keep broker feeds updated and reliable. - Exclude Pairs from Alerts
Specify pairs to exclude from alerts using a comma-separated list. - Use PIN for Experts (EAs)
Secures Expert Advisors with a PIN for enhanced security.
Forex 28 Navigator: The Ultimate Multi-Signal, Multi-Timeframe, Multi-Pair Indicator
Forex 28 Navigator is a highly versatile indicator designed for all timeframes, providing signals for all 28 currency pairs on a single chart. It is packed with features and is fully configurable to meet the needs of any trader.
Please take your time to thoroughly study this indicator. This is not just a simple tool—think of it as flying a helicopter rather than riding a bicycle.
Seven Key Features:
- Double-GAP Alert: Displays arrows and info on the dashboard, indicating strong momentum in two currencies, with buy and sell suggestions across multiple pairs. Quick-open chart button included.
- Outer Market Fibs Hit Alert: Warns when a currency strength reaches extreme levels.
- Hook Alert: Notifies you of a currency strength reversal from extreme levels.
- Cross Alert: Signals a trend change with the Currency Strength cross pattern.
- GAP Arrow: Indicates the minimum momentum in currency strength.
- Pink X Warning Sign: Alerts to extreme levels in currency strength.
- Market Conditions: Provides an overview of current market activity.
Each of these signals can be finely tuned to your preferred trigger values. Since every trader has a unique approach to the market, you can choose which signals to trade and customize the settings to perfectly align with your trading style and psychology.
Functionality tested, in build 1431 working.
Reminder: As with every trading system, always remember that forex trading can be risky. Don’t trade with money that you can not afford to lose. It is always best to test EA’s first on demo accounts, or live accounts running low lotsize. You can always increase risk later!
Recommend, in order not to miss important news and updates on the site, subscribe to our telegram channel https://t.me/Fx_VIP
DOWNLOAD EA Forex 28 Navigator


Rafa28
27/08/25
It’s requested to be updated. Is there a solution?
Thanks for all the contributions.
Fx-VIP.pro team
27/08/25
Not yet, if this happens we will notify in our telegram channel https://t.me/Fx_VIP