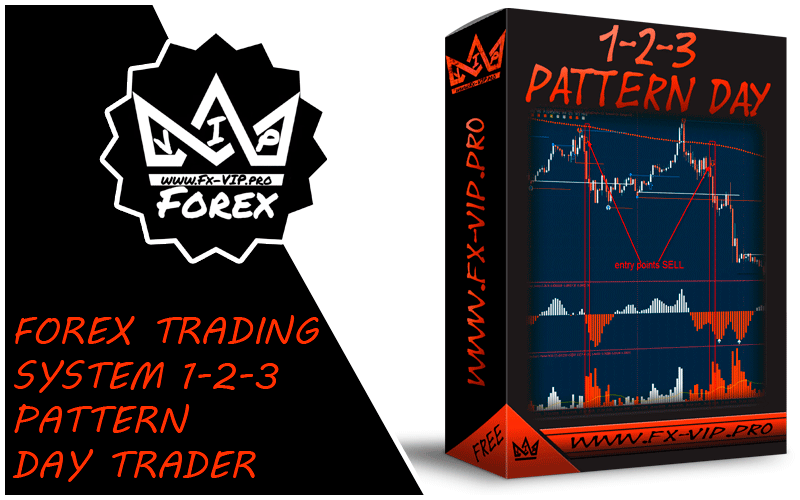
1-2-3 Pattern Day Trader is a profitable Forex trading system based on Price Action 1-2-3 chart pattern and trend filtering . It helps identify important key lows and highs at which traders can trend with a high risk to reward ratio.
SPECIFICATIONS:
Terminal: MT4
Currency pair: Any
Timeframe: M5-M30
Recommended brokers:NPBFX, ALPARI, Amarkets
INDICATORS USED:
This system consists of various indicators that help traders to identify and trade in the correct direction of the market near support and resistance zones.
- 123PatternsV6.ex4
- 123PatternsV7 Alerts.ex4
- Day_Bar.ex4
- Day_Expl_D1.ex4
- Day_Heiken_Ashi.ex4
- Day_Look.ex4
- Day_open_line.ex4
- Day_signal_arrow.ex4
- Day_signal_ultra.ex4
Let’s try to understand how this trading system works.
123 PATTERN DAY TRADER REVIEW
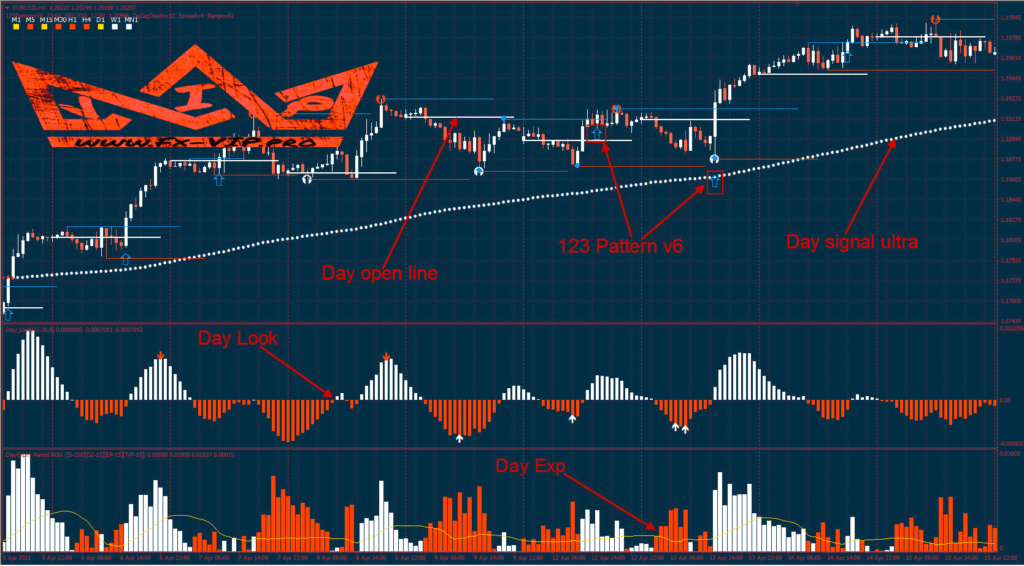
Day signal ultra – is a moving average based indicator that helps smooth out price action data and determine the market trend.
If the price is above the day signal ultra , the color of this band will change to white, and if the price is below the day signal ultra , the color of this indicator will turn red.
The slope of the day signal ultra is very important for determining the strength of the trend. If the price is above this indicator and the slope is up, then only traders should look for long trades, and if the price is below the day signal ultra and the slope of this indicator is down, then traders should look for short trades.
Day look – is another trend-following indicator that plots a histogram higher or lower depending on the difference between long-term and short-term moving averages.
- If the histogram is below the zero line, prices are in a downtrend, and if the histogram is above the zero lines, then the price is moving in an uptrend.
- If the price is above the daily ultra Day look signal and the Day Exp indicators form a red histogram, it means that prices are in the retracement zone after the uptrend.
- If the price is below the daily ultra Day look signal and the Day Exp indicators form a white histogram, this means that prices are in the retracement zone after the downtrend.
Support and resistance levels are used to enter a trend. If this trading system generates a buy signal and the price is trading near support, it is possible to buy with a stop loss below the support zone.
If the system generated sell signal and the price is trading near resistance, you can open a sell trade with a stop loss above the resistance.
There are several options for trading this trading system.
Following a trend – when all indicator signals indicate the continuation of the price movement in one direction: up or down.
And the option of trading on pullbacks .
RULES FOR TRADING WITH A TREND
Signals indicating the opening of a BUY position:
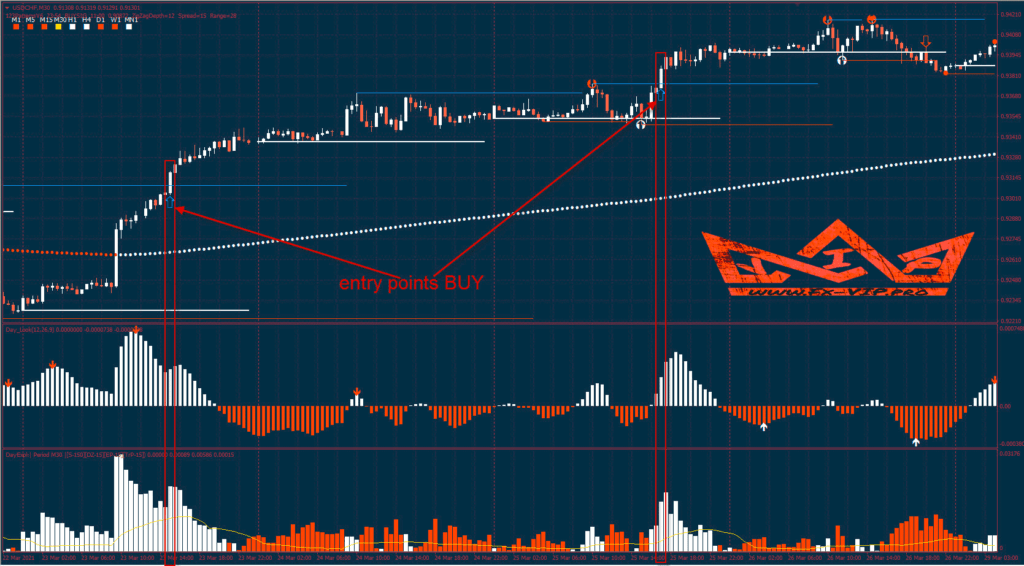
- 123 pattern V6 displayed an up arrow
- White dots on the Day signal ultra moving line
- Day Look shows white stripe
- On the Day Exp of the day, the white bar is above the moving average.
Signals indicating the opening of a SELL position:
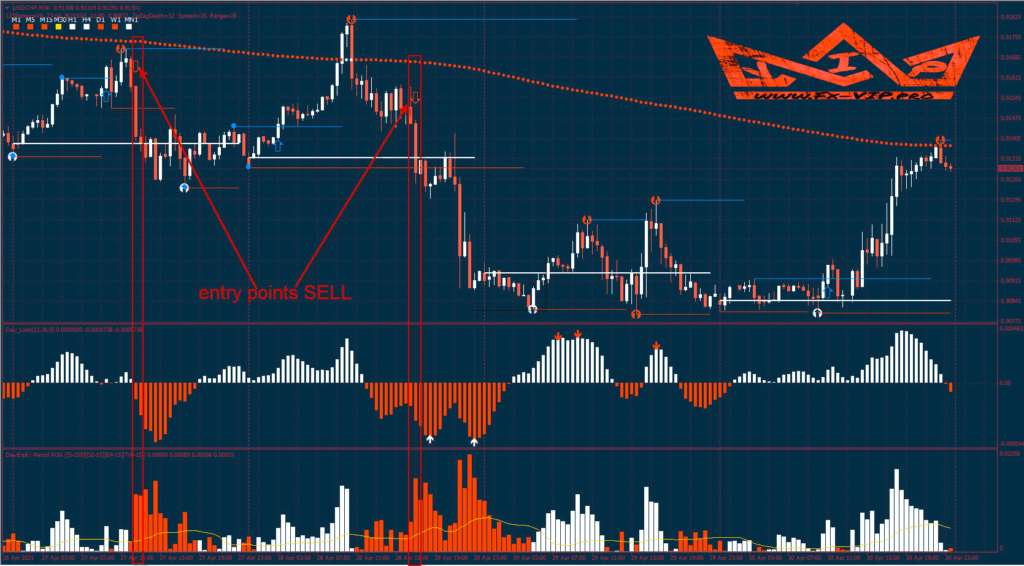
- 123 pattern V6 displayed down arrow
- Red dots on the Day signal ultra line
- Day Look Shows Red Stripe
- On the Day Exp of the day, the red bar is above the moving average.
PULLBACK TRADING RULES:
BUY terms:
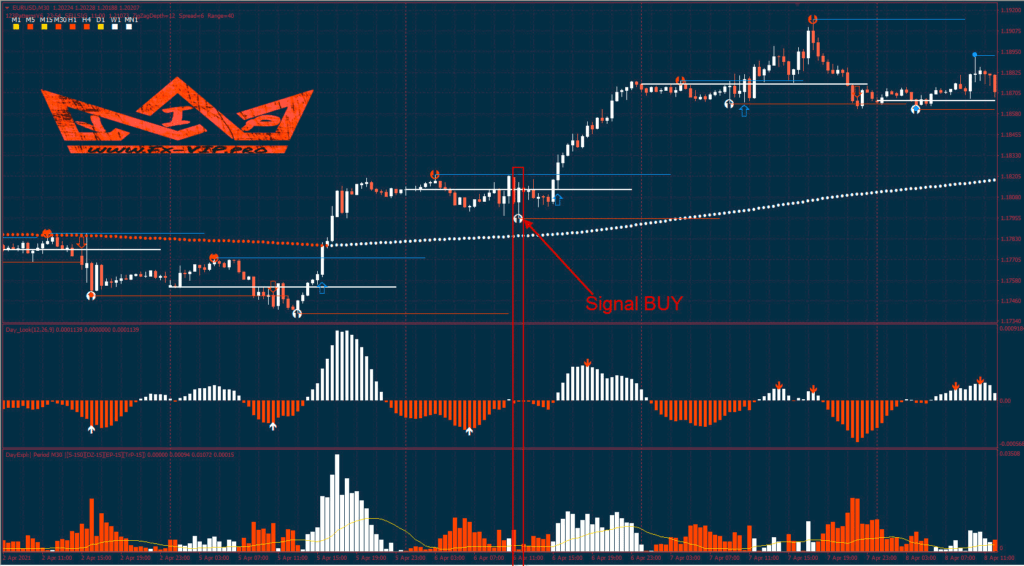
- Price should be making a higher high and a higher low.
- The price should rise above the Day signal ultra indicator.
- The slope of the day ultra signal should rise.
- The price should pull back in an uptrend, and the daily look and the daily expiration histogram should turn red.
- A buy signal near the support zone is a signal to enter a long position.
- Stop loss is below the support zone.
SELL terms:
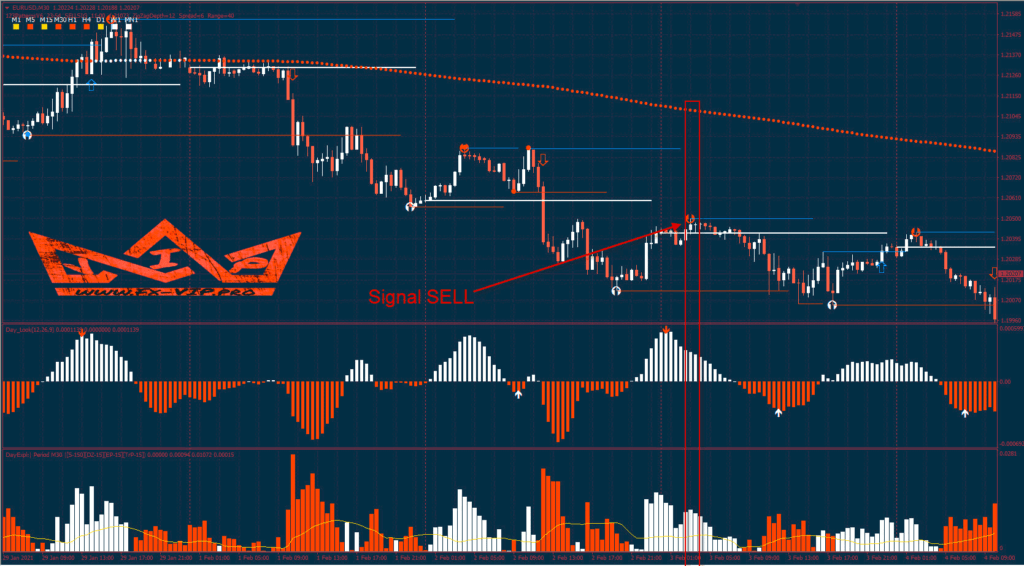
- The price should form a lower high and a lower low.
- The price should move below the Day signal ultra indicator.
- The slope of the daily ultra signal should be decreasing.
- Price should bounce back in a downtrend, and the daily histogram and daily exhaustion histogram should turn white.
- A sell signal near a resistance zone is a signal to enter a long position.
- Stop loss is above the resistance zone.
PLACEMENT OF STOP LOSS AND TAKE PROFIT
Stop loss is set 5-10 pips above / below the signal bar;
Take Profit order is set depending on the used currency pair and timeframe. Recommended values: M5: 7–12 pips, M15: 8–15 points, M30: 15–25 pips.
Please note that stop loss and take profit order sizes are indicative and may vary depending on the currency pair and timeframe. You can also use a trailing stop, but in this case, the profitability of the strategy may decrease.
The 123 Pattern Day Trader Forex strategy has simple trading rules, so it shouldn’t be difficult even for novice traders
We recommend not to open positions before, during and after the release of important macroeconomic news.
Please also test the strategy on a demo account before using it on a live account.

Ahmed Negm
25/05/22
Thanks